 It’s considered conventional wisdom that the fiercest competitors can be found in the world of professional sports. After almost 30 years working in employee benefits, I beg to differ.
Greatly exacerbated by today’s low unemployment rate, the competition for talent in the business world today is as fierce as I’ve ever seen it, most especially in the fields of construction, dining, cybersecurity, nursing, and finance, just to name a few. Bryce Harper and Tom Brady have nothing on today’s business professionals in charge of talent acquisition.
As if competing for customers wasn’t enough, companies often compete against each other for the same pool of talent, whether that be within specialized industries or simply within an overlapping geographic region.
In the quest to attract the best talent, employee benefits benchmarking is crucial. This practice allows employers to gauge their organization's position in terms of benefits versus the competition. Some companies regularly conduct benchmarking as part of a strategy of good governance, while others perform benchmarking in response to something specific, such as an acquisition, the need to fill a specific role, or the launch of a new division.
Introducing Our New Partnership & Benchmarking Study
This year the JP Griffin Group joined with United Benefits Advisors to produce the nation’s largest independent health plan benchmarking survey. In doing so, we’ve created the most comprehensive source of reliable benchmarking data for employers of all sizes.
The tremendous scope of this year’s survey allows regional, industry-specific, and employee size differentials to emerge from the data. All three of these factors are critical to producing meaningful comparisons.
In addition, the sheer enormity of plans represented allows for a broader range of plan features to compare. Data in this year’s benchmarking report is based on responses from 8,072 employers sponsoring 14,131 health plans covering over one million employees nationwide. Altogether, this survey is nearly three times larger than the next two largest health plan benchmarking surveys combined. The resulting volume of data provides employers of all sizes more detailed - and therefore more meaningful - benchmarks and trends than any other source.
Key Findings
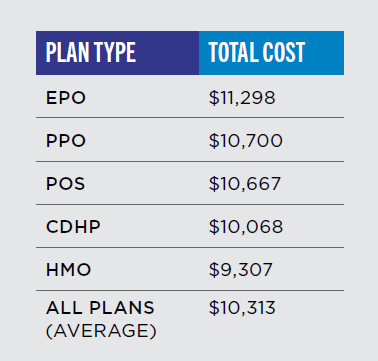 Our 2019 Employee Benefits Benchmarking Study reveals several noteworthy trends and developments that are vital for employers who are interested in making the most informed health care plan decisions possible. Here is just a topline summary of findings. We encourage you to download a complimentary copy of our in-depth benchmarking report for the complete analysis.
For those who are interested in a custom-level report, comparing your specific health plans to those of companies in industries or geographies similar to and/or identical to yours, contact us . Our interactive benchmarking tool allows for quick yet insightful custom benchmarking analysis you can put to use right away.
Regional Health Plan Costs
Regional cost averages varied significantly this past year, making it essential to benchmark both nationally and regionally. Though historically the lowest cost, health plans in the Central U.S. experienced the largest increase in costs in 2017, rising 4.4%, and again this year they experienced a 4.7% increase. The North Central U.S. experienced the largest increase of 5.8% in 2018 compared to the five other regions delineated in the survey.
While plan costs in the West rose only slightly in 2017 (1.2% from 2016 to 2017), this year, costs in the West actually decreased 4.0% from 2017 to 2018, making plans in the West among the lowest cost (largely due to the increase in CDHP plan enrollment across the region as well as the continued prevalence of HMO plans in California, as discussed elsewhere in our report).
Medical Premiums In General
Average health plan costs continue to rise, with 2018 premium increases at the highest level in the last decade. The average initial or proposed rate increase reported for 2018 was 13.9%, with final rate increases averaging 9.8% after negotiation.
Initial analysis indicates that employees bore the majority of those increases, particularly those enrolled in PPO plans, with the average cost for employees increasing by 6%. Employers, on the other hand, increased their contributions by 3.1% of the premium increases for PPO plans, on average. For a break-out of changes to medical premiums by plan type, including HMOs, PPOs and CDHPs, download the complete study here. Looking for our 2019 report? Click here
Health Plan Costs By Company Size
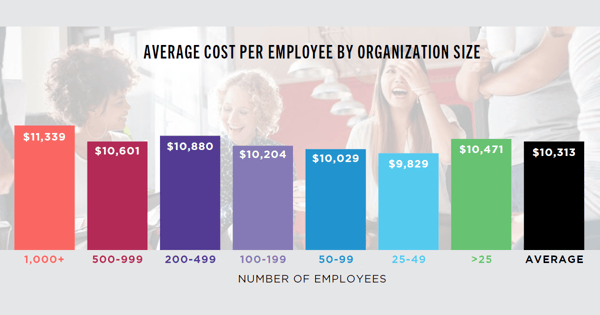
Generally, larger groups (those with 200 to 1,000+ employees) pay more than average per employee due to more generous benefit levels. Despite these employers’ ability to negotiate better rates (and the fact that, unlike small groups, they are not required to comply with age and community rating, which drives costs higher), most large employers still saw larger increases this year (after a year of relatively flat costs from 2016 to 2017). Hardest hit were employers with 1,000+ employees, who saw on average a 9.6% increase over 2017 (from $10,346 to $11,339).
For the last few years, small groups obtained refuge from rate increases with grandmothering and plan design choices (reducing prescription drug coverage and turning to lower-cost CDHP and HMO plans). But those strategies were not a source of relief in 2018, with most small employers experiencing an average 4.2% increase in costs.
Health Plan Costs By Industry
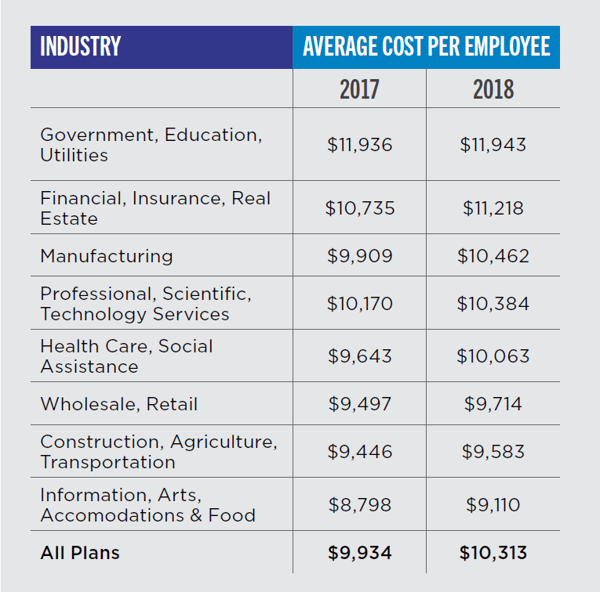
The government/education/utilities sector has the priciest plans, at $11,943 per employee, virtually unchanged from last year. Total costs per employee for the construction/agriculture, retail, hospitality, and healthcare sectors are all lower than average, making employees in these industries among the least expensive to cover. This is typically due to the lower average age among this workforce combined with less rich plans. Manufacturing experienced the highest increase - 5.6% - in average cost per employee, going from $9,909 in 2017 to $10,462 in 2018.
Deductibles
Median in-network deductibles for single coverage remained steady across all plans for 2018 at $2,000, although median in-network PPO deductibles increased from $1,500 in 2017 to $2,000 in 2018. The overall median out-of-network deductibles for single coverage saw a 12.5% increase from $4,000 in 2017 to $4,500 for 2018.
Dependent Coverage
Dependent enrollment increased significantly, by 35.2%, from 44.3% in 2017 to 59.9% in 2018. This was a reverse of the trend seen in previous years of decreased dependent enrollment. This could signal a trend to watch, as individual or Marketplace premiums rise quickly with the sunset of the Transitional Reinsurance Fee and other risk protections afforded to carriers under the Patient Protection and Affordable Care Act (ACA).
Spousal & Partner Coverage
9.8% of all employers provide no domestic partner benefits. This is likely due to the Supreme Court’s decision in Obergefell v. Hodges, which legalized same-sex marriage, giving employers a less complicated method to provide coverage for same-sex partners. As a result, many employers are covering just legal spouses rather than legal spouses and domestic partners.
Infertility Coverage
21.5% of plans offer full infertility evaluation and treatment (down from 22.4% last year). The vast majority of plans offer evaluation only or no infertility coverage at all. Interestingly, the top five states for full fertility benefits are Hawaii (100% of plans), Connecticut (94.7% of plans), Illinois (85.6%), Massachusetts (87.3%), and Maryland (79%) though these benefits are mandated by law.
HSA and HRA Contributions
The health savings account (HSA) average single contributions rose to $763 in 2018, compared to $477 in 2017, a 60% increase. Conversely, health reimbursement arrangement (HRA) maximum reimbursements decreased from $1,983 for a single employee to $1,547, a decrease of 22%. (Click here to learn more about how to get your employees to contribute more to their HSAs.)
Grandfathering
Grandfathered plans only account for 3.9% of plans reported in 2018, a decrease of more than 86% compared to the 7.3% of grandfathered plans reported in 2017. (Grandfathering refers to a health plan that was in place prior to March 23, 2010, and that maintains certain exemptions from several ACA requirements. In exchange for those protections, grandfathered plans must not deviate from strict limitations on acceptable changes to the plan or cost sharing between the employer and employee.)
Grandmothering
Plans that are considered to be grandmothered in the small group market experienced a drastic 91.7% decrease from 2017 (and down 207% from 2015). The grandmothering provisions have been extended several times since 2014 and are expected to continue, although that may change quickly given the political winds in Washington, D.C. Grandmothering allows some small employers to maintain plans that are not considered grandfathered, but would otherwise not comply with the ACA insurance market reforms and the metal levels for plans as of January 1, 2014.
Self-Funding
A dramatic increase in self-funding was seen for 2018, with 20% of all plans in some form of self-funding arrangement (compared to 12.8% of plans in 2017). While self-funding has been attractive to the larger group market in the past, the insurance carriers in the smaller markets have introduced plans that are either in the self-funded or level premium modes of financing health plans.
The survey data shows rapid adoption rates of self-funding in the small group markets, with an increase of 122% in the 25 to 49 life groups and a 28.5% increase in the 50 to 99 life market. Conversely, there is a decrease of almost 6% of employers that are self-funding their health plans in the 1,000 or more employee size category (57.3% of plans).
Wellness Programs
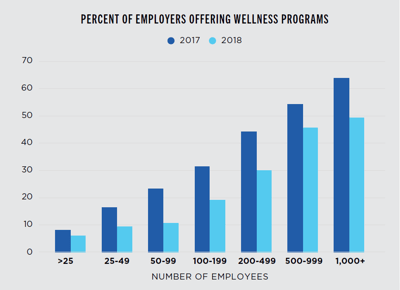 14.9% of all employers offer comprehensive wellness programs, a 36.6% decrease from 2017. Of these employers, 71.9% include health risk assessments, 69.5% offer employee incentives for participation, 64.4% offer biometric screenings or physical exams, 60.4% include on-site or telephone coaching for high-risk employees, and 42.7% include seminars or workshops. Health risk assessments have decreased nearly 8.4% since 2014 when 80.3% of plans had a health risk assessment.
The use of health risk assessments is worth watching closely due to the government’s increased scrutiny and regulation regarding their use. The primary form of wellness incentives are in the form of gift certificates or health club dues. Wellness programs are most prevalent among Northeast employers (25.3%), plans sponsored by government/ education employers (23.6%), and larger groups (45.7% for groups with 500 to 999 employees, and 49.4% for groups with 1,000+ employees).
Prescription Drug Plans
Prescription drug plans are changing in many of the markets across the country in an attempt to combat the ever-rising cost of prescription medications. In addition, plans have become more complicated, with benefit structures that can include copays, coinsurance, a combination of copays and coinsurance, deductibles, and the types of medications in each tier.
Survey data shows the majority of plans have either a three-, four- or five-tier benefit structure. Benefit levels for generic prescriptions have not had significant changes, with median and average copays hovering right at a $10 copay across all tier structures. For those plans with three or more tiers, the out-of-pocket costs for brand name and specialty tiers have increased, some quite significantly.
Given the complexity of the data, watch for a special report to be released by us on prescription benefit trends in the future. In that report, past trends will be highlighted, which should give some foresight on the wave of the future in prescription benefits and associated out-of-pocket costs.
Accurate Benchmarking Gives Employers An Edge
By using this data, the JP Griffin Group can help employers more accurately evaluate costs, contrast the current benefit plan’s effectiveness against competitors’ plans, and adjust accordingly. While there are pros and cons to employee benefits benchmarking, this gives employers a distinct competitive edge in negotiating rates—and recruiting and retaining a superior workforce.
As stated early, it bears repeating - for those who are interested in a custom-level benchmarking report, comparing your specific health plans to those of companies in industries or geographies similar to and/or identical to yours, contact us. Our interactive benchmarking tool allows for a quick, yet incredibly insightful custom benchmarking analysis you can put to use right away.
Do you know where your employee benefits program stands against those with whom you compete for talent? Interested in a custom-level benchmarking report? Leave us a comment or contact us. We'd love to hear from you! Looking for our 2019 report? Click here



![Crucial Employee Benefits Trends [2020 Employee Benefits Benchmarking Study]](https://www.griffinbenefits.com/hs-fs/hubfs/benchmarking%20final.png?width=240&name=benchmarking%20final.png)


