 For the past 15 years United Benefit Advisors® (UBA), of whom JP Griffin Group is a proud member, has surveyed thousands of employers across the nation regarding their health plan offerings, their ongoing plan decisions in the face of significant legislative and marketplace changes, and the impact of these changes on their employees and businesses.
The UBA Health Plan Survey has become the nation’s largest independent health plan benchmarking survey and the most comprehensive source of reliable benchmarking data for employers.
In fact, UBA’s survey is nearly three times larger than the nations’ next two largest health plan benchmarking surveys combined. The resulting volume of data provides employers of all sizes more detailed—and therefore more meaningful—benchmarks and trends than any other source.
UBA recently released its 2020 Employee Benefits Health Plan Survey. This year’s survey aggregates inputs from over 11,788 employers, 21,980 health plans, and 1.3 million nationwide employees.
The scope of this year’s survey allows regional, industry-specific, and employee size differentials to emerge from the data. In addition, the large number of plans represented allows for both a broader range of categories by plan type than traditionally reported, and a larger number of respondents in each category.
Historically, these types of benchmarking data were unavailable to small and mid-size employers, while for larger employers, the survey provides benchmarking data on a more detailed level than ever before.
By using this data, the JP Griffin Group can help employers more accurately evaluate costs, contrast the current benefit plan’s effectiveness against competitors’ plans, and adjust accordingly. This gives employers a distinct competitive edge in negotiating rates—and recruiting and retaining a superior workforce.
The 2020 Health Plan Survey reveals several noteworthy trends crucial for employers looking to make informed health care plan decisions. This article summarizes the report’s key findings. We encourage you to download a complimentary copy of our in-depth benchmarking report for the complete analysis.
2020 HEALTH PLAN SURVEY FINDINGS
Regional Health Plan Costs
After record-high increases in medical premium of nearly +10% in 2018, the past two years have been more manageable. While carriers initially proposed 2020 increases closer to +5%, on average, savvy negotiation and quality benchmarking helped employers halve this figure to a +2.4% increase nationwide.
From a regional perspective, the North Central region incurred the lowest average increase at +.09%, followed by the Southeast region at +1%. Conversely, the Central and Northeast regions experienced the highest increase in premiums at +3%. (Historically, the lowest cost plans were typically found in the Central region, but that is no longer the case.)
On at state-by-state basis, Montana, Colorado, Missouri, Kansas, and Idaho all ranked in the top five least expensive states for employer-sponsored health plans (Arizona ranked 8th). New York, Massachusetts, Vermont, New Jersey, and Connecticut ranked as the top five most expensive states for employer-sponsored health plans.
Average Percent Employee Contribution
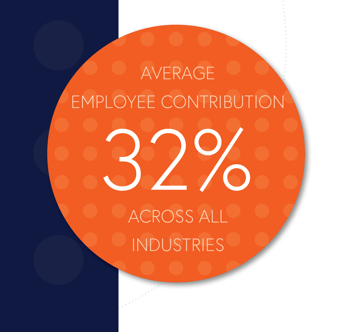
Employees, on average, contributed 32% toward the total plan costs in 2020. Comparatively, employees contributed 32.7% in 2019, and 31.2% in 2018. Experts had anticipated that employers would likely continue to move further away from the standard 70/30 employer/employee cost sharing, however, that trend seems to have slowed over the past three years. This is a metric worth monitoring as we continue towards the future.
When examining specific industries, the percentage difference in contributions fall within a range of about 13 percentage points. Government employees enjoy the richest plans and the lowest costs to employees at 23.4%. In comparison, employers in the construction, agriculture, and transportation industries offer the least cost sharing, with employees paying 36.4% of plan costs.
Average Cost by Industry
For 2020, the average cost of plans across all industries was $10,736. The most expensive plans were from the government, education, and utility industries averaging $12,324, which was up +1.6% from 2019.
On the opposite end of the spectrum, the construction, agriculture, and transportation industry averaged $10,130 per year, and the information, arts, accommodation, and food industries averaged $9,660 per year. These industries are generally lower than average due to the workforce's younger age, as well as less rich plan offerings. The construction industry had the largest cost increase in 2020 at +4.6%, with the technology sector following at a +3.8% increase.
Plan Type by Region
The most prevalent plan choice across the country in 2020 was, by far, PPO/POS plans, averaging between 44.2% and 62.8% in each region. Even the Western region, which has historically leaned towards HMO/EPO plans, offered more PPO plans. Bear in mind that states such as California, Colorado, Florida, and Hawaii have the highest HMO markets, with 52.4% of California employers offering HMO/EPO plans.
Even though PPO/POS plans are the most common nationally, the North Central region is starting to lean towards HSA plans, with 38.8% of employees choosing to participate. The Southeast still heavily chooses PPO plans, but enrollment for HMO/EPO plans is rising.
It is helpful for employers to understand what types of plans appeal to employees within their region, as they select what plans to offer their workforce. The popularity of plan types differs by region, by state, and even within the state itself. For those looking for more localized benchmarking, contact us. We'll be more than happy to provide a state-level report upon request.
Cost Sharing by Organization Size
When it comes to the average cost per employee, larger groups (with over 200 employees) pay more on average due to more generous benefit levels. Over the last three years, the largest groups (with over 1000 employees) have seen considerable increases, with a 9.6% increase in 2018, a 4.9% increase in 2019, and a 6.1% increase this year.
The national increase average in 2020 was 2.4% across all groups, with middle-market employees (500 to 999 employees) being hit the second hardest at 3.8%. The smallest groups had the lowest increase at 1.7%, which they generally achieved by applying higher deductibles, increasing their employees' share of the premium, and adding more levels to the prescription drug plans.
Deductible Costs
In-network deductibles for singles remained largely unchanged in 2020, although in-network family deductibles did increase an average of $500 for those with PPO/POS and HMO/EPO plans. All plans highly discourage participants from using out-of-network physicians. To do this, plans have significantly increased out-of-network deductibles. For example, singles on a PPO/POS plan who received out-of-network care faced a $5,000 deductible, up $1,000 from last year alone.
Download the full report for more information on copays, dependent coverage, spouse and partner coverage, infertility services, and HSA/HRA contributions.
Self-Funding
Across all plans, approximately 80% are fully insured, and 20% are self-funded or level funded. Self-funding is on the rise nationally and across group size. As of 2020, 66% of large employers, 30% of midsize employers, and 18% of small employers have chosen to self-fund. Small employers have seen a massive increase in self-funding, up from 7% five years ago. Depending on your region and company size, self-funding may be a funding strategy worth evaluating.
Wellness Programs
Wellness programs were offered by 15.2% of all employers this year. Larger groups make up the highest percentage of wellness program offerings, with groups with 500 to 999 employees at 40.9% and those with over 1,000 employees at 58.3%. While wellness programs have always been enticing for employees, they became even more popular this year when many companies offered paid time off as a reward for participating.
Prescription Drug Plans
As prescription drug plans become more complicated, companies are offering more options to employees and creating more tiers to separate out the options. Three-tier drug plans are on the way out and are increasing up to six tiers depending on the business size.
As 2020 Comes to an End
Since the outbreak of the coronavirus pandemic, legislation passed into law to protect individuals and prevent the virus's spread has changed our entire economic system. As more legislation comes to fruition, JP Griffin will continue to monitor how health plans are changing to adjust to this new world and how that will affect you.
Accurate Benchmarking Gives Employers an Edge
While there are pros and cons to employee benefits benchmarking, it can give employers a distinct competitive edge in negotiating rates — and recruiting and retaining a superior workforce.
For those who are interested in a custom-level benchmarking report that compares your specific health plans to those of companies in industries or geographies similar to and/or identical to yours, contact us. Our interactive benchmarking tool allows for a quick, yet incredibly insightful custom benchmarking analysis you can put to use right away
Download your complimentary copy of the 2020 Employee Benefits Health Survey Summary here.


